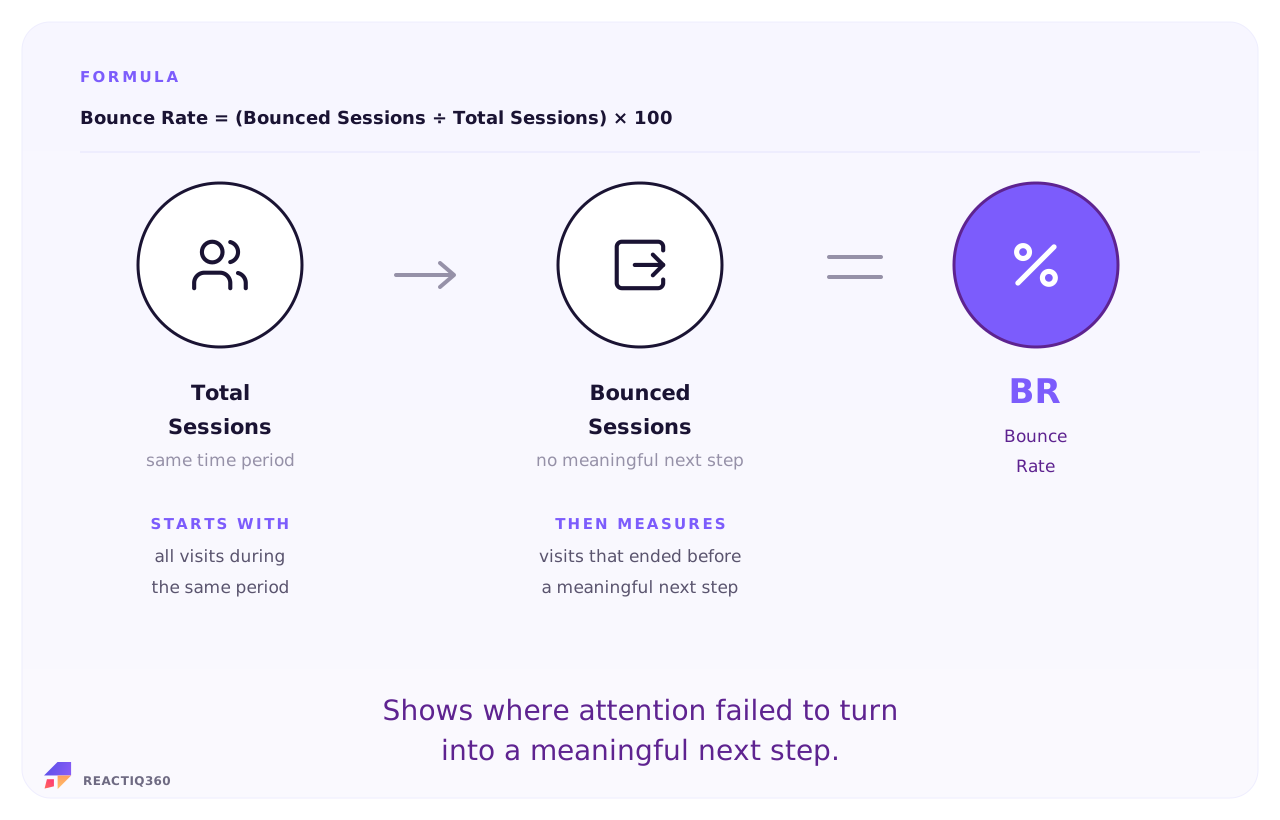
Bounce Rate
Bounce Rate (BR)
Bounce Rate, or BR, measures how often visitors leave after a single page, before doing anything meaningful.
Divide single-page sessions by total sessions. That is Bounce Rate: how often visitors leave without doing anything. Bounce Rate is the ultimate metric for measuring immediate user rejection. It cuts through vanity numbers to track the exact percentage of visitors who land on a page and turn right around to leave without clicking a single link, filling out a form, or visiting a second page. It is your digital first impression score. A sky-high bounce rate is a loud warning sign that your landing page didn’t deliver what your ad promised, your website is loading too slowly, or your layout is too confusing. Before you invest more budget into driving traffic, you need to find out why your audience is walking out the door the second they arrive.
Signal Type
Metric Role
Metric Type
Last Updated
The Formula
Worked example

Check the context of the exit.

Here is a performance team evaluating a specific landing page optimization campaign. They review total campaign visits alongside single-page sessions that triggered zero additional events or interaction criteria to isolate the true bounce performance.

Bounce Rate Calculator Section
Landing Page Traffic Analysis
Total Site Entries (Sessions) 12,000

Single-Page Exits (Zero Interactions) 5,400
45%
Bounce Rate
(5,400 bounces ÷ 12,000 entries) × 100
Keep your comparisons objective. Running your raw single-page bounces directly against total arrivals from that exact same source keeps your performance tracking realistic.
Benchmarks and interpretation

Bounce Rate tracks how many people leave your page instantly. But a "good" bounce rate depends entirely on the design of the page. A high bounce rate on an informative blog post is perfectly normal because users get their quick answer and head out. That same high bounce rate on a dedicated lead-generation landing page or e-commerce store is a structural emergency. Your bounce numbers only make sense when judged against the job the page was built to do.

Page Type Typical Bounce Rate Design Context
Lead-Gen Landing Pages 30% – 50% Highly focused layouts with a clear, single CTA. Higher numbers mean bad traffic or weak copy.
E-commerce Stores 25% – 45% Users should navigate to catalog items or carts. Spikes mean hidden shipping fees or slow page speed.
Blogs & Content Hubs 65% – 90% Expected informational behaviour. Users read the answer and leave. Fix with better internal links.
B2B Corporate Sites 40% – 60% Multi-page exploratory hubs. High bounces mean your homepage is confusing or navigation is broken.
The bounce reality check
Evaluating your bounce rate requires looking directly at traffic channel intent. Cold display network traffic or random organic referral visitors will inherently bounce at a massive rate compared to your warm email list or branded search terms. Always split your bounce rates by source so an influx of exploratory top-of-funnel traffic doesn't trick you into thinking your web layout is broken.

Where the number actually comes from

Bounce Rate lives inside your web analytics tracking code. When a browser loads your site, the script checks if the user does anything else or leaves immediately. Because different modern tools define an "interaction" differently, pulling data straight from a dashboard without checking the background session configurations can distort your funnel health analysis.

Here is exactly where each piece of the puzzle lives and what you need to look out for:

Bounce Rate Data Sources Table
Source What it provides Important nuance
Web analytics GA4, Plausible, Fathom The raw ratio of unengaged single-page sessions to total site entries. Make sure you know your tool's exact engagement threshold. In GA4, if a user spends 11 seconds reading your headline text and leaves, it is recorded as an engaged session—not a bounce.
Site speed trackers PageSpeed Insights, Pingdom Core Web Vitals and asset load-time timelines. Slow page speed directly forces high bounce rates. If your heavy media assets take 6 seconds to show up on mobile, a user will hit back before your analytics tracking script even finishes loading.
UX Behavior maps Hotjar, Clarity, Lucky Orange Session recordings and scroll-depth heatmap visibility. Use these tools to see if "bouncing" users are rage-clicking broken buttons or leaving because your pop-up window blocked the content on mobile screens.
When to use it

Bounce Rate is the right metric in these decision contexts:

Bounce Rate Bullet List
  • Evaluating ad-to-page alignment. Comparing bounce rates shows if your landing page fulfills what your creative promised. High bounces mean a broken user expectation.
  • Spotting page performance issues. Sudden spikes in bounce rates often point to technical glitches. Use it to uncover broken elements or sluggish mobile loading speeds.
  • Auditing traffic source quality. If a specific ad platform brings high traffic volume but a 90% bounce rate, the platform is optimizing for accidental clicks, not buyers.
  • Optimizing user onboarding content. High bounces on documentation or guide pages highlight friction. Use it to rebuild layouts that keep readers engaged.
  • Filtering out vanity search clicks. Driving thousands of monthly organic views means nothing if everyone bounces. Use it to audit and fix your content relevance.
Common Mistakes

Bounce Rate is one of the most misreported metrics in marketing. The most common errors:

Bounce Rate Mistakes List
  • Mixing up GA4 engagement metrics with old session rules. GA4 tracks Engagement Rate and flips the math, ignoring exits if the user stays for 10+ seconds. Know your tracking platform's math.
  • Panicking over high bounce numbers on single-page content. A user reading an informational blog post for five minutes gets their answer and leaves satisfied, but legacy pixels still track it as a bounce.
  • Relying on a single blended bounce rate across all hardware. A clean 35% global site average can hide a beautiful 15% desktop experience paired with a broken, 80% mobile viewport layout.
  • Ignoring suspiciously flawless bounce scores near zero percent. If your analytics dashboard reports a bounce rate below 5%, your tracking code is almost certainly double-firing on page load.
  • Blaming your landing page design instead of your ad targeting. Poor ad placement or mismatched search intent will ruin the bounce metrics of even the most perfectly designed web page.
In the REACT framework

BR sits in the Act phase. High bounce on action pages means the ad and the page told two different stories. One catch: platforms disagree on what a bounce is, and GA4 does not even report it by default. REACTIQ360 harmonises BR into one definition, so comparing GA4 with SEMrush compares the same thing.

Frequently Asked Questions
What is Bounce Rate?
Bounce Rate, or BR, measures how often visitors leave after a single page, before doing anything meaningful. It shows where your traffic and your pages are telling different stories.
How do you calculate Bounce Rate?
Use the formula: Bounce Rate = (Single-Page Sessions ÷ Total Sessions) × 100. Keep both inputs in the same reporting period and avoid mixing users, sessions, events, or customers unless the formula calls for it.
What data do you need for BR?
You need total website sessions and single-page sessions, pulled from the relevant connected sources and computed for the same period.
What mistakes should you avoid with BR?
Do not treat every bounce as failure, do not read bounce without traffic source, and do not fix the page before checking whether the ad made a promise the page never could keep.
When should marketers use BR?
Use BR when deciding whether a page or a traffic source needs fixing. High bounce on action pages plus paid traffic is the combination that costs money fastest.
What is a good BR?
It depends entirely on page intent. A blog post can bounce heavily and still do its job. An action page should not. Compare pages against their own purpose and history, not a global average.

Sources and methodology. BR formula and definition derive from standard marketing analytics practice and platform reporting conventions. REACTIQ360 harmonises source data from GA4 / web analytics, Tag manager and site events, Harmonisation layer and applies a consistent same-period computation methodology.

One screen.
One story. One move.
REACTIQ360 harmonises CAC and 129 other digital marketing metrics into one decision-ready intelligence layer. Powered by proprietary metrics and agentic AI. Beta access is invite-only.
Join the beta waiting list