
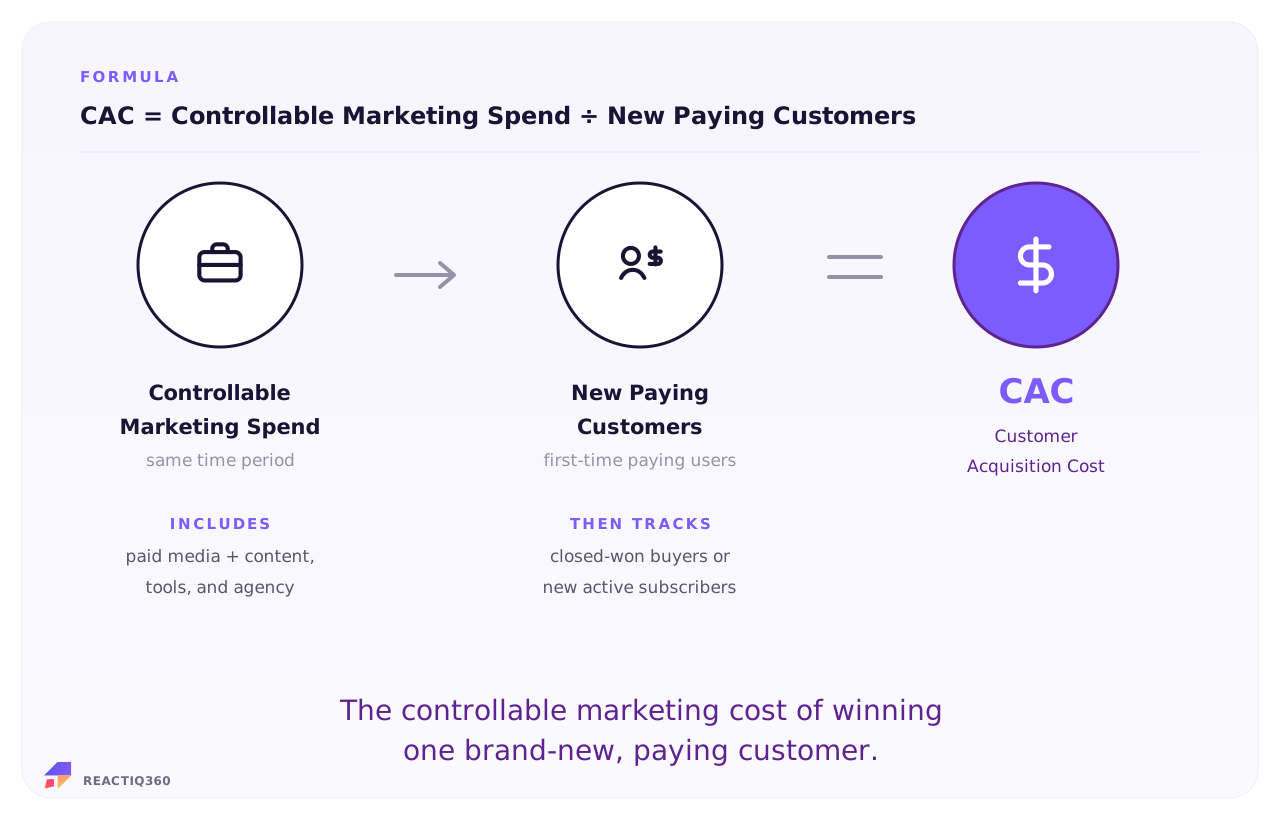
Run the number once and it sticks.
Here's a B2B SaaS team closing the books on Q2. They add up the marketing acquisition spend for Q2, divide it by the new paying customers won in Q2, and keep both sides of the formula in the same window.
Is your CAC any good?
CAC answers: what did it cost marketing to acquire one new paying customer? LTV:CAC answers the next question: was that cost worth it compared to the value that customer creates? That is why CAC has no universal “good.” A high CAC can be healthy when customer value is strong. A low CAC can still be weak if customers churn quickly or spend very little. CAC only makes sense against customer value and relevant benchmarks.
Here's what the textbook definition skips: no platform hands you CAC. Meta won't report it. Google won't. GA4 won't. It doesn't exist until you build it by stitching four sources together, which is exactly why so many CAC numbers are quietly, confidently wrong.
One split worth knowing: blended CAC and paid CAC answer different questions.
Blended CAC divides total marketing acquisition spend by all new paying customers. It shows the overall cost of acquiring customers across your marketing mix.
Paid CAC divides paid media spend by the new paying customers attributed to paid channels. It shows whether your ad spend is pulling its weight.
Track both. Paid CAC can look healthy while blended CAC is quietly rising because of creative costs, agency support, tools, content, or other acquisition activity. That gap is worth catching early.
CAC is the right metric in these decision contexts:
CAC is one of the most misreported metrics in marketing. The most common errors:
CAC is the cost-efficiency signal of the Convert phase: what it cost marketing to turn demand into a new paying customer. On its own, CAC answers what acquisition cost. Paired with customer value, it shows whether that cost was worth it.
REACTIQ360 pulls marketing acquisition spend from connected channels, matches it to new-customer counts, computes CAC for the same period, and outputs one usable number. Then it breaks CAC down by channel, so you can see what is pulling its weight and what is making acquisition more expensive.
See how CAC fits the REACT Framework →
CpCon

CPL
CLV

Sources and methodology. CAC formula and definition derive from standard unit economics literature, including the work of David Skok (Matrix Partners) on SaaS economics, the CFI Customer Acquisition Cost guide, the Wall Street Prep SaaS CAC framework, and the NetSuite ERP CAC reference. Industry benchmarks for 2025 to 2026 aggregated from publicly available SaaS metrics reports and DTC ecommerce industry analyses. Harmonised CPCo computation methodology is REACTIQ360 proprietary.

One story. One move.


