Engaged Reach
Engaged Reach (EngR)
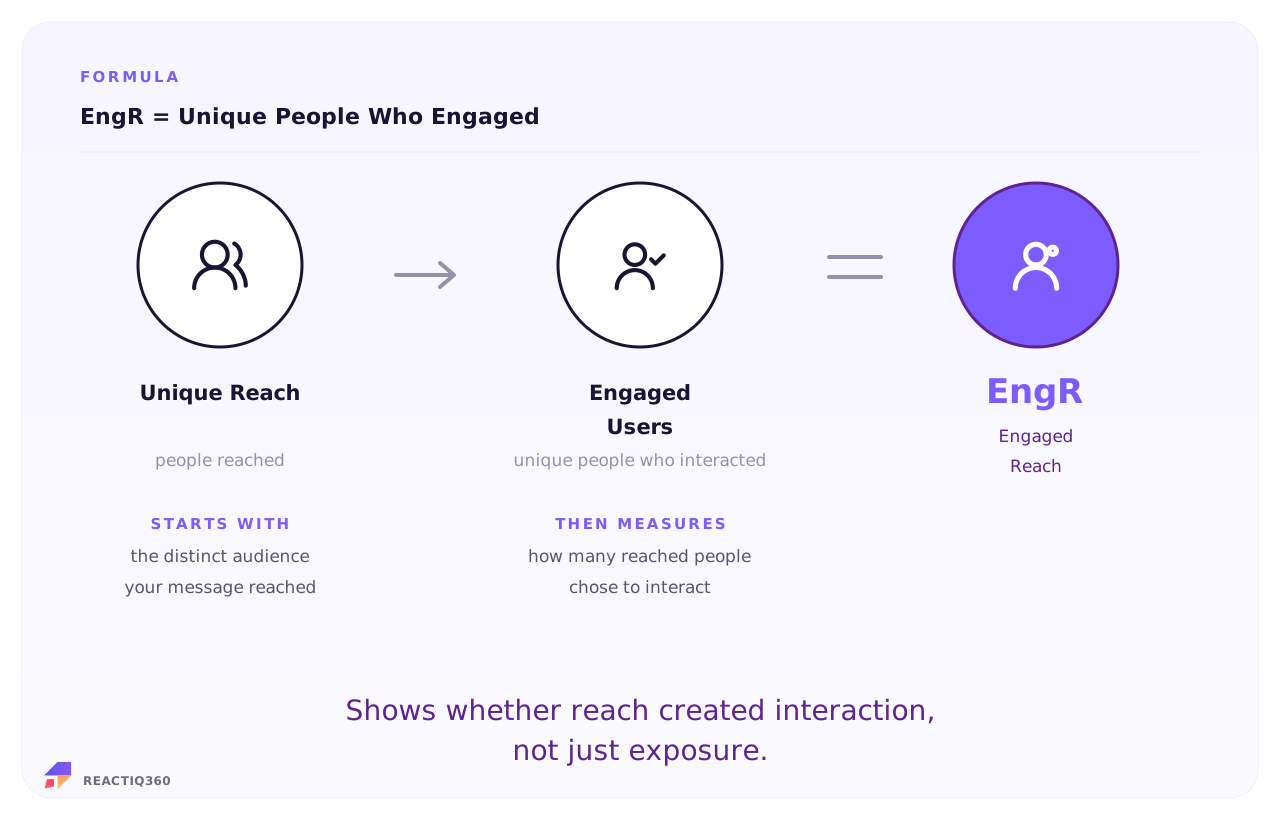
The unique number of people who didn't just scroll past your content, but stopped to interact.
Count the unique users who interacted at least once to get Engaged Reach (EngR). EngR counts the unique people who didn't just scroll past your content, but stopped to interact. Think of standard reach as people walking past your store window, and EngR as the ones who actually come inside. It is the ultimate awareness reality check because it cuts through vanity numbers to show exactly how many real humans are truly paying attention.
Signal Type
Metric Role
Metric Type
Last Updated
The Formula
Worked example

Isolate your audience pool to check real engagement.

Here is a digital team tracking an organic content campaign. They pull the absolute volume of unique users who saw the update, isolate the specific count of unique profiles that interacted intentionally, and calculate their real engaged reach.

EngR Calculator Section
Campaign Audience Audit
Total Unique Profiles Reached 80,000

Unique Engaged Profiles 4,800
6%
Engaged Reach
(4,800 engaged ÷ 80,000 reached) × 100
Align your timeline context. Counting the exact unique profiles that took action inside that specific publication window keeps your engagement maps realistic.

Benchmarks and interpretation

Engaged Reach shows who is actually pausing to interact with your brand. Do not obsess over a single benchmark; only compare scores within the same channel and format. A targeted native ad naturally beats a generic banner blast. Track this breakdown to prove which messages truly resonate so you can confidently scale what works.

Profile Scale Typical EngR Community Context
Niche / Community Page 8% – 15% Highly focused profile topics. Users feel active peer ownership and join discussions quickly.
Mid-Size Mid-Tier Page 4% – 7% Standard content presence. Broad professional audiences reviewing insights occasionally throughout the week.
Large Enterprise Page 1% – 3% Mass corporate reach scales. Algorithmic newsfeed limits thin out the percentage of active user interactions.
The volume dilution check
Evaluating your EngR requires tracking your paid distribution swings. A sudden rush of broad paid traffic or generic promo reach will naturally dilute your engagement ratio, even if your organic core remains entirely thrilled with your brand updates. Always review your reach shifts within specific, localized visibility layers so that sudden network pushes do not trick you into thinking your content appeal is failing.
Where the number actually comes from

You won’t find a single, global Engaged Reach database because ad networks calculate user sessions differently. Pulling a true score requires cross-referencing your public social analytics dashboards with your site tracking pixels to see who crossed over into your actual business orbit.

Here is exactly where each piece of the puzzle lives and what you need to look out for:

EngR Data Sources Table
Source What it provides Important nuance
Social Dashboards LinkedIn, Meta Business Hub The unique user profile count tracking intentional actions. Platforms count reactions and expanding photo clicks as engagement actions. Remember that these channels calculate unique profiles differently, so focus your analysis on trends within each specific platform.
On-site Analytics GA4, custom pixel setups The count of unique visitors arriving via social link parameters. This tracks users who click your bio or story references. Ensure you filter for unique active users instead of general website hits to keep your customer interest maps accurate.

When to use it

EngR is the right metric in these decision contexts:

EngR Bullet List
  • Evaluating creative impact. EngR isolates real human interest from passive feeds, helping you see if your hooks are strong enough to stop the scroll.
  • Auditing co-marketing partnerships. Comparing creator-level EngR shows who actually commands an attentive audience, ensuring you sponsor channels that drive real community alignment.
  • Tracking organic algorithmic favor. When platform algorithms push your content to new groups, tracking EngR verifies if this expanded reach is finding relevant people.
  • Optimizing video content pacing. Spikes or drops in your EngR metrics across video campaigns pinpoint exactly where viewers lean in or get bored.
  • Predicting community pipeline strength. Monitoring your EngR curves over a quarter lets you forecast how many unique accounts are primed for deep retention offers.
Common Mistakes

Separating passive eyeballs from genuine attention can be tricky. When analyzing EngR, these are the most frequent data traps to watch out for:

EngR Mistakes List
  • Confusing unique engaged users with total click actions. A single passionate follower clicking an asset five times counts as five engagements but only one unit of Engaged Reach.
  • Relying on platform auto-play views to claim true intent. Counting video scrolls that play silently in the background for three seconds overstates your actual attentive audience size.
  • Blending paid promo audiences with organic community circles. Pumping budget behind a post inflates your raw metric, masking the underlying organic appeal of the message.
  • Accepting empty bot interactions into your data files. Click networks and automated scrapers will trigger engagement filters, faking high metrics while offering zero genuine customer interest.
  • Evaluating engagement scores across erratic timeline windows. Forgetting that organic content has a slow trailing lifecycle makes comparison data erratic if you close your tracking windows too early.

In the REACT framework

Engaged Reach sits in the Engage phase and counts people instead of actions. It is the scale half of EIS and your honest measure of how many people you are actually moving.

Frequently Asked Questions
What is Engaged Reach?
Engaged Reach measures how many unique people actually engaged, not how many engagements you counted. It tells you how many actual people you moved, not how busy your notifications were.
How do you calculate Engaged Reach?
Use the formula: Engaged Reach = Total Unique Engaged Users. Keep both inputs in the same reporting period and avoid mixing users, sessions, events, or customers unless the formula calls for it.
What data do you need for ER?
You need gross reach and people who engaged, pulled from the relevant connected sources and computed for the same period.
What mistakes should you avoid with ER?
Do not read total engagements as people, and do not celebrate engagement growth without checking whether the engaged audience actually widened. Loyal repetition and real growth look identical in a raw count.
When should marketers use ER?
Use Engaged Reach when judging audience growth. It decides whether rising engagement means a widening audience or the same loyal few acting more often, and those call for different plays.
What is a good ER?
Good is growth: more unique people engaging period on period. Judge the level against your reach, because ten thousand engaged people means something different under a small audience than a vast one.

Sources and methodology. ER formula and definition derive from standard marketing analytics practice and platform reporting conventions. REACTIQ360 harmonises source data from Platform APIs, Content taxonomy, Harmonisation layer and applies a consistent same-period computation methodology.

One screen.
One story. One move.
REACTIQ360 harmonises CAC and 129 other digital marketing metrics into one decision-ready intelligence layer. Powered by proprietary metrics and agentic AI. Beta access is invite-only.
Join the beta waiting list