Retention
Talk
Positive Sentiment Rate
Positive Sentiment Rate (PSR)
Positive Sentiment Rate (PSR) is the percentage of your total online conversation that is explicitly positive.
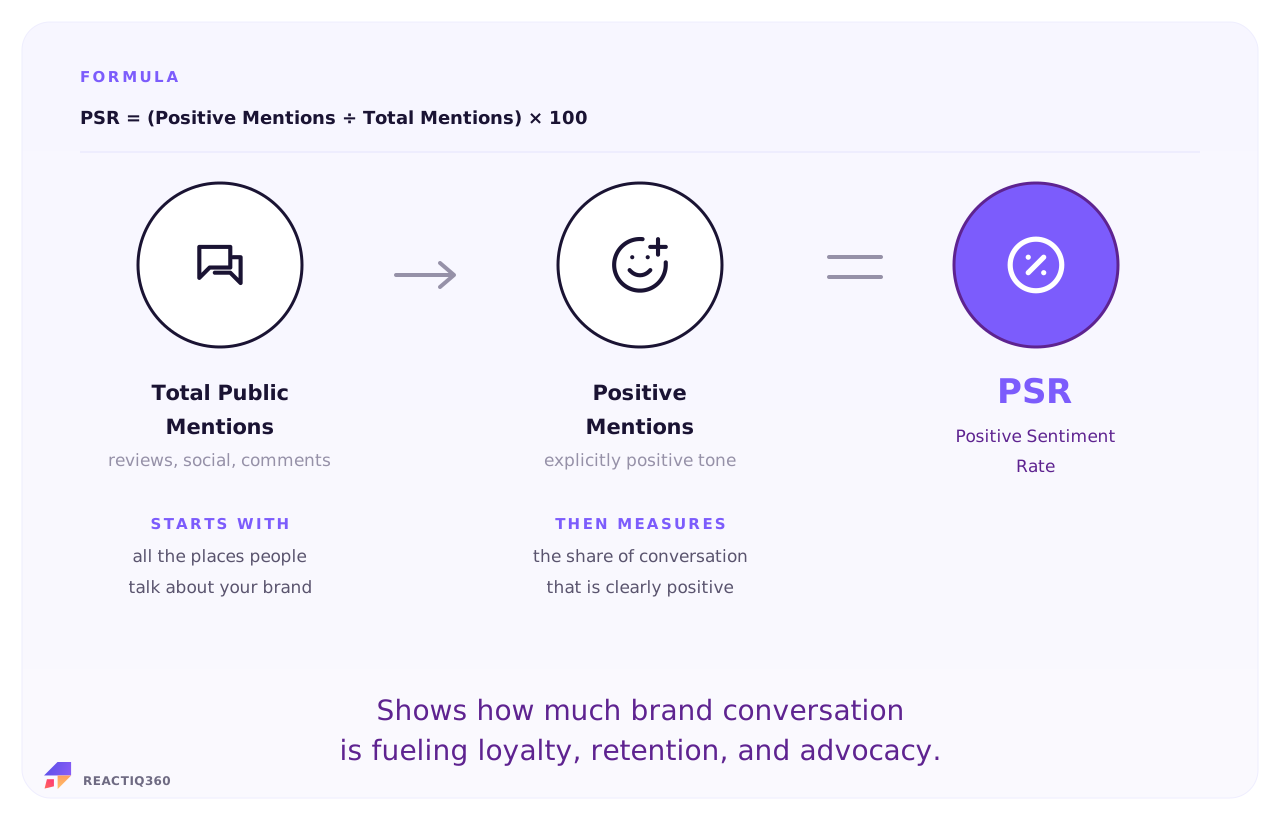
Positive Sentiment Rate (PSR) is positive mentions divided by total mentions, multiplied by 100. PSR measures the exact proportion of brand conversations that carry an explicitly optimistic tone. While other metrics look at the net balance of critics and fans, PSR focuses strictly on tracking your total volume of brand applause. It serves as a vital strategic signal of customer satisfaction and deep relationship health. It highlights how to successfully nurture initial customer delight into lasting brand loyalty, higher retention, and a powerful engine of organic advocacy.
Signal Type
KPI
Metric Role
Metric Type
Last Updated
The Formula
Worked example

Determining a brand's positive vibe.

Here is a marketing team reviewing public chatter after a major brand ambassador campaign. They aggregate all categorized brand comments across networks, map the volume of explicitly positive entries against the total conversation pool, and calculate their real positive sentiment rate.

PSR Calculator Section
Ambassador Campaign Mention Audit
Explicit Positive Mentions 3,600
Neutral / Passive Comments 1,600
Negative Mentions (Ignored in Math) 800

Total Classified Mentions 6,000
60%
PSR Rate
(3,600 positive ÷ 6,000 total) × 100
Align your timeline context. Measuring your positive mention volumes directly against your total conversation records over that exact window keeps your tracking accurate.

Benchmarks and interpretation

PSR tells you what percentage of your brand conversation is positive. But a "good" number depends entirely on the value threshold you are unlocking. Your PSR becomes a powerful strategic asset when you weigh your fan volume against the long-term customer relationships and advocacy loops it unlocks.

Enthusiasm Zone Typical PSR Advocacy Context
Low Engagement Zone Below 25% Very little active enthusiasm. Conversations are heavily dominated by passive notices or negative support tracking.
Standard Market Baseline 25% – 45% Healthy, normal presence. The quiet majority of conversations remain neutral or transactional, with a solid stream of user approval.
High Brand Affinity 46% – 65% Strong value thresholds. Product launches and marketing campaigns are successfully triggering active organic recommendations.
Vocal Fandom Core 66%+ Premium relationship equity. Exceptional user community passion unlocking consistent organic growth and powerful viral loops.
The sentiment dilution check
Evaluating your PSR requires tracking your neutral comment volume shifts. A massive surge of completely neutral transactional updates or generic sweepstake shares will naturally dilute your positive percentage score, even if your true customer core remains entirely thrilled with your product. Always review your advocacy metrics inside localized communication layers so that outside volume swings do not trick you into thinking your fan base is shrinking.

Where the number actually comes from

You won’t find a pristine Positive Sentiment Rate sitting inside a standard website dashboard. True PSR requires pulling public conversation logs via social scrapers or review trackers and processing them through a clean text sorting layer. If you rely entirely on unverified network summaries, miscategorized phrases will skew your calculation.

Here is exactly where each piece of the puzzle lives and what you need to look out for:

PSR Data Sources Table
Source What it provides Important nuance
Listening scrapers Meltwater, Sprout Social The raw count of public comments and automated sentiment classifications. Ensure your scraping keywords isolate direct product conversations. Allowing wide corporate industry chatter into the stream will inject irrelevant data that shifts your true metric score.
Community platforms Discord, Reddit, specialized hubs Direct customer text entries and peer recommendation threads. Community platforms highlight your most valuable organic advocates. Keep in mind that highly vocal super-users write a high volume of these posts, which can slightly overstate broader market trends.
Customer surveys Post-chat queries, typeforms Direct feedback scores from users answering specific queries. Surveys give you clean, structured sentiment data. Make sure you only tally completed entries that choose a positive category option, leaving out incomplete responses to protect the denominator.

When to use it

PSR is the right metric in these decision contexts:

PSR Bullet List
  • Tracking advocacy and enthusiasm waves. PSR isolates the loud, positive reactions inside your brand mentions. Use it to measure how many people are actively cheering for your product.
  • Evaluating influencer campaign creative. Comparing campaign-level PSR reveals which creator content triggers the highest percentage of genuine fandom and positive community replies.
  • Gauging product feature delight. Running PSR across user feedback folders immediately highlights which new software tools or platform updates are sparking the most organic praise.
  • Auditing brand ambassador performance. Tracking partner-specific PSR values shows which loyalty programs or affiliate channels are delivering high-value user affinity instead of casual traffic.
  • Measuring customer success impact. Pairing monthly support-tier PSR swings with your user retention metrics provides an honest look at how helpful experiences drive long-term loyalty.

Common Mistakes

Measuring fan enthusiasm has its own set of unique data traps. When analyzing your PSR, these are the most frequent blind spots to watch out for:

PSR Mistakes List
  • Relying on PSR to track your complete brand reputation. Because PSR completely ignores negative feedback volumes, a high score can easily mask a massive public relations crisis building in parallel.
  • Letting automated classifiers guess online humor. Software scrapers frequently struggle with sarcasm or regional slang, which can falsely log cynical internet comments as positive data entries.
  • Failing to align total sorted message parameters. Throwing raw, un-analyzed entries into the calculation mix without stripping out unrelated search strings will completely warp your actual rate trends.
  • Chasing higher applause rates over realistic audience feedback. Heavily scrubbing or deleting critical comments from public profiles artificially inflates your PSR data while destroying genuine community trust.
  • Isolating the calculation to a single discussion forum. Reviewing fan interactions strictly on one network disconnects your metric from user sentiment patterns building up across other spaces.
In the REACT framework

Positive Sentiment Rate (PSR) sits in the Talk phase, where advocacy has quality, not just volume. Tone turns before retention numbers do, so a sentiment break is your cue to act. By the time churn confirms it, sentiment flagged it a quarter ago.

Frequently Asked Questions
What is Sentiment Score?
Sentiment Score, or SMT, measures the net tone of what people say about your brand: positive mentions minus negative, as a share of all mentions. It tells you whether the conversation about you is helping or hurting.
How do you calculate Sentiment Score?
Use the formula: SMT = (Positive Mentions - Negative Mentions) ÷ Total Mentions × 100. Keep both inputs in the same reporting period and avoid mixing users, sessions, events, or customers unless the formula calls for it.
What data do you need for SMT?
You need total public mentions and emotional net weight, pulled from the relevant connected sources and computed for the same period.
What mistakes should you avoid with SMT?
Do not read sentiment without volume, since ten glowing mentions can mask a thousand silent leavers. And treat automated tone classification as directional: sarcasm still fools machines.
When should marketers use SMT?
Use Sentiment when a trend breaks: a sustained turn in tone is your cue to investigate now, because tone usually moves before retention numbers confirm the damage.
What is a good SMT?
Consistently net positive with stable volume is healthy. The absolute score matters less than departures from your own baseline, especially sudden ones.

Sources and methodology. SMT formula and definition derive from standard marketing analytics practice and platform reporting conventions. REACTIQ360 harmonises source data from Social listening and reviews, Classification logic, Harmonisation layer and applies a consistent same-period computation methodology.

One screen.
One story. One move.
REACTIQ360 harmonises CAC and 129 other digital marketing metrics into one decision-ready intelligence layer. Powered by proprietary metrics and agentic AI. Beta access is invite-only.
Join the beta waiting list