Impressions
Impressions (Imp)
Impressions (Imp) count how many times your content was pushed out by a server, not how many human eyes actually saw it.
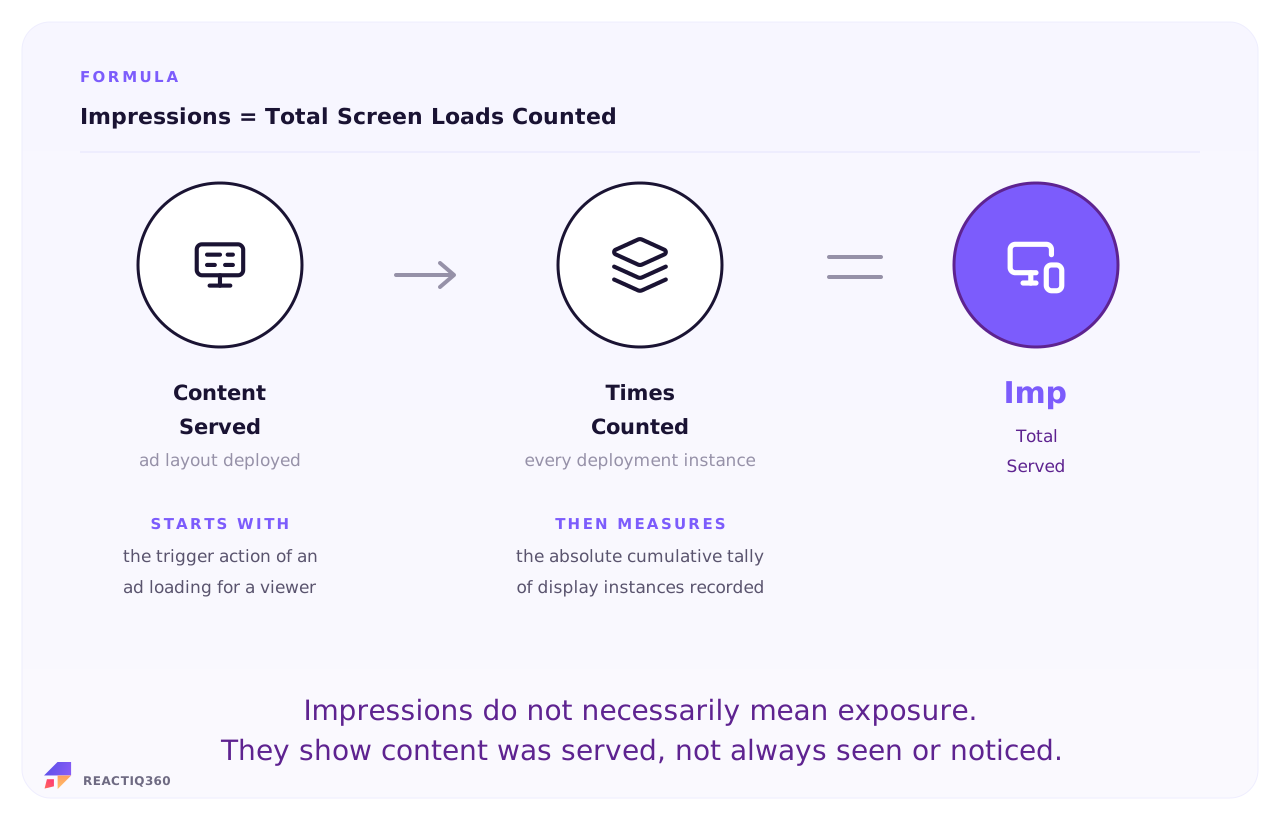
Impressions count every time your ad or content is served to a screen, even if it never fully loads or gets seen. It tells you how many times your asset was technically delivered, making it a measure of server distribution rather than actual human eyeballs.
Signal Type
Metric Role
Metric Type
Last Updated
The Formula
Worked example

Add up your numbers to see where your ads actually served. Here is a team reviewing a recent campaign to check their overall distribution scale across different channels. They pull the total number of times their ads were successfully served on each platform and combine them to see the true volume of their campaign.

Impressions Calculator Section
Campaign Distribution Audit
Programmatic Native Ads 650,000
Paid Search Network 200,000
Direct Publisher Placements 150,000

Total Campaign Impressions 1,000,000
1,000,000
Total Impressions
Sum of all system ad load triggers
Align your timeline context. Counting the total number of code execution events recorded over that specific publication window ensures you get an honest view of ad server activity.
Benchmarks and interpretation

Since many ads load completely out of sight, pairing your raw volume with native viewability rates or industry benchmarks is a smart strategic move. Applying those visibility baselines helps you filter out unseen placements and gauge the true on-screen impact of your media budget.

Channel Strategy Volume Scaling Profile Delivery Footprint Context
Direct Publisher Premium Moderate Scale Guaranteed inventory delivery slots. Renders strictly in high profile frames with minimal layout clipping risks.
Native / Discovery Networks High Scale Content feed placements scale fluidly based on user scrolling volume. Reliant on layout generation tech.
Open Programmatic Exchanges Massive Scale Bidded display blocks load across millions of web nodes instantly. Carries elevated below the fold loading risks.
The distribution scale check
Reviewing your total raw volumes serves as an excellent delivery pipeline blueprint. A campaign that logs massive impression volume might look impressive on high level reports, but it actively hides operational inefficiencies if your downstream interaction rates are flat. Tracking this volume breakdown is a smart strategic move, letting you audit network delivery pipelines to ensure you can confidently scale your upcoming top of funnel visibility campaigns.

Where the number actually comes from

Raw delivery numbers come directly from each network's ad server. Because there is no single global tracker, you can use a data connector to plug into these separate channel feeds and see your total volume in one place.

Impressions Data Sources Table
Source What it provides Important nuance
Ad Networks Google Ads, Meta Business Manager The total volume of server-side code triggers executed. Dashboards register an impression the moment an ad script loads in a container. Keep in mind that this logs raw script delivery entries, completely separate from screen visibility conditions.
Publishing Portals Direct media hubs, Content tools Independent local ad server display logs. Direct publishing networks count file downloads or asset transfers locally. Always verify time zone parameters between external dashboards and internal calendars to ensure clean alignment.
When to use it

Impressions are the right metric in these decision contexts:

Impressions Bullet List
  • Measuring distribution engine volume. Use raw impression tallies to verify if an ad exchange is executing your budget allocations and physically delivering your creative assets.
  • Calculating downstream conversion ratios. Keep tabs on total impressions because it acts as the primary top-of-funnel denominator for identifying click and action efficiency trends.
  • .
    Auditing programmatic delivery pace. Review your daily impression trends to catch sudden layout distribution stalls or unexpected technical ad delivery blocks early in the run.
  • Sizing overall brand awareness campaigns. Track impression footprints during broad market announcements to gauge the physical scale of your presence across paid media networks.
  • Identifying creative fatigue points. Watching your impression counts scale upward while click ratios plummet tells your creative group exactly when it is time to refresh your assets.
Common Mistakes

When you rely strictly on raw delivery data, you are looking at server pings, not human behaviour. Here are the biggest blind spots that can skew your data:

Impressions Mistakes List
  • Confusing total impression counts with unique user reach. An impression logs every standalone rendering event, meaning one single user scrolling past your banner five times logs as five impressions.
  • Equating a successfully rendered impression with an screen view. Standard network pixels fire the instant code calls, meaning millions of impressions load completely out of view below the page fold.
  • Treating massive impression spikes as evidence of audience interest. High delivery logs confirm digital placement presence but offer absolutely zero insight into whether real human eyes noticed the message.
  • Allowing programmatic bot loops to bloat your volume metrics. Fraudulent web scripters and automated traffic generators spin up fake ad loads, draining budgets while overstating delivery data.
  • Evaluating raw footprints without segmenting the traffic channels. Blending highly viewable premium placements with cheap background open exchange spots creates a deceptive global footprint baseline.
In the REACT framework

Impressions open the Reach phase. REACT treats them as fuel, not proof: delivery is not awareness. Impressions tell you how loudly you spoke. Qualified Reach tells you who actually heard.

Frequently Asked Questions
What is Total Served?
Total Served, or Imp, counts how many times your ad or content was served, not how many people saw it. It sets the volume baseline that every efficiency metric divides by.
How do you calculate Total Served?
Use the formula: Impressions = Total Screen Loads Counted. Keep both inputs in the same reporting period and avoid mixing users, sessions, events, or customers unless the formula calls for it.
What data do you need for Imp?
You need content served and times counted, pulled from the relevant connected sources and computed for the same period.
What mistakes should you avoid with Imp?
The mistakes are old but alive: reporting served counts as people reached, ignoring viewability, and letting one person seen ten times masquerade as ten people seen once.
When should marketers use Imp?
Use impressions as a denominator and a delivery check, not as a result. The decisions they support are about volume: is enough being served, and is the arithmetic underneath CTR and CPM sound?
What is a good Imp?
There is no good number of impressions, only enough to feed the metrics built on them. Judge delivery against plan, and judge meaning through viewability, reach, and qualification.

Sources and methodology. Imp formula and definition derive from standard marketing analytics practice and platform reporting conventions. REACTIQ360 harmonises source data from Ad and platform APIs, Campaign taxonomy, Harmonisation layer and applies a consistent same-period computation methodology.

One screen.
One story. One move.
REACTIQ360 harmonises CAC and 129 other digital marketing metrics into one decision-ready intelligence layer. Powered by proprietary metrics and agentic AI. Beta access is invite-only.
Join the beta waiting list