
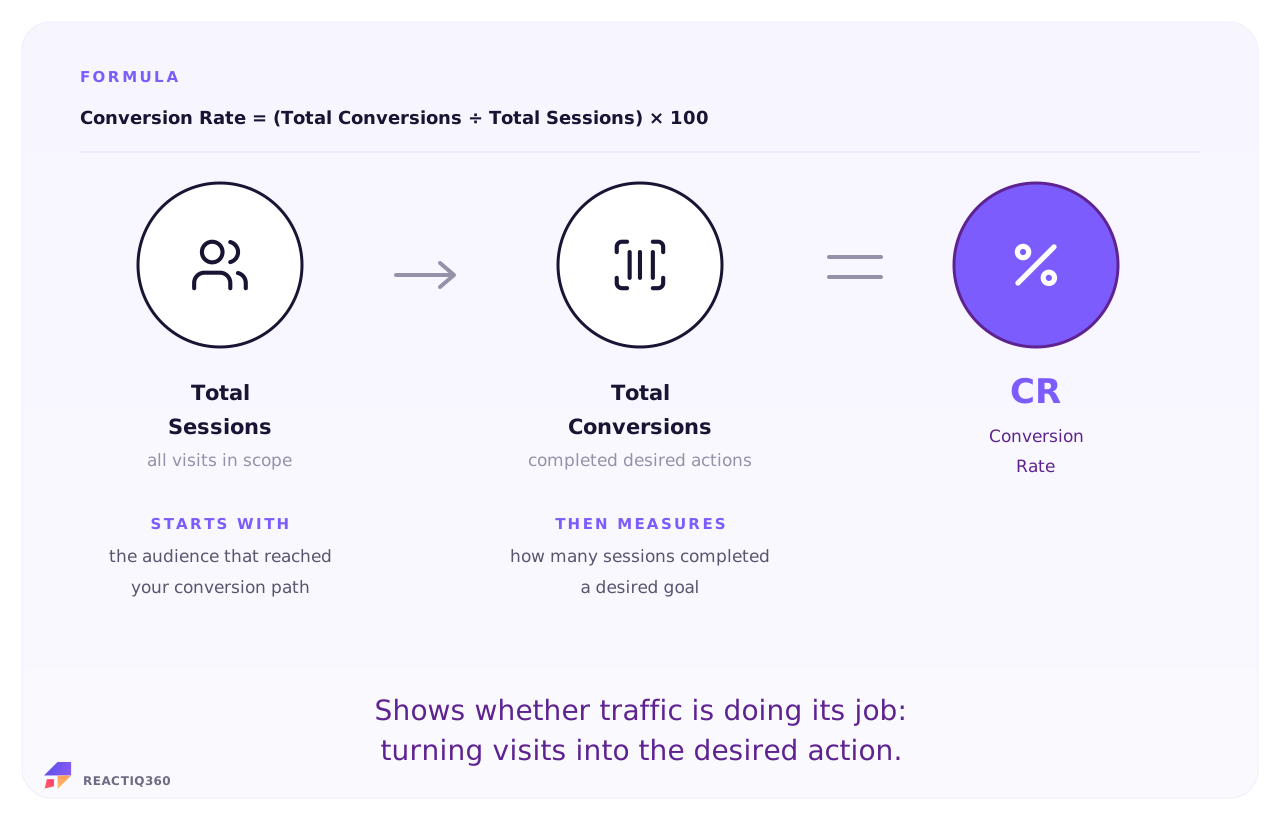
Isolate your segments to get a true reading.
Here is a marketing team looking at a dedicated promotional campaign for a new feature. They take the absolute session traffic sent directly to that landing page, check the backend database for finalized signups from that unique pool, and calculate the clear conversion performance.
Conversion Rate tells you what percentage of your traffic takes action. But a "good" conversion rate varies completely depending on what you are asking people to do. Convincing someone to type their email for a free newsletter is an easy ask. Convincing them to pull out a credit card for an expensive software trial takes serious work. Your conversion rate only makes sense when judged against the amount of effort required from the user.
You won’t find a single source of truth for Conversion Rate sitting inside a lone dashboard because conversion signals are messy. Your analytics platform tracks clicks and sessions, while your billing platform or CRM tracks real cash and contracts. If you rely blindly on an automated pixel calculation, your numbers will get skewed by bot traffic, abandoned carts, or multi-device journeys.
Here is exactly where each piece of the puzzle lives and what you need to look out for:
CR is the right metric in these decision contexts:
CR is one of the most misreported metrics in marketing. The most common errors:
CR sits in the Convert phase. Alone, it grades your experience. Next to Reach and Engage signals, it reveals whether a low CR is a conversion problem or a traffic problem in disguise. Diagnose upstream before rebuilding the checkout.
CpCon

AOV
CAC
CPA
ROAS
ROMI

Sources and methodology. CR formula and definition derive from standard marketing analytics practice and platform reporting conventions. REACTIQ360 harmonises source data from Ad platforms and marketing spend, CRM / ecommerce / billing, Harmonisation layer and applies a consistent same-period computation methodology.

One story. One move.


