Cost per Conversion
Cost per Conversion (CPCon)
Cost per Conversion, or CPCon, measures how much spend it takes to produce one conversion.
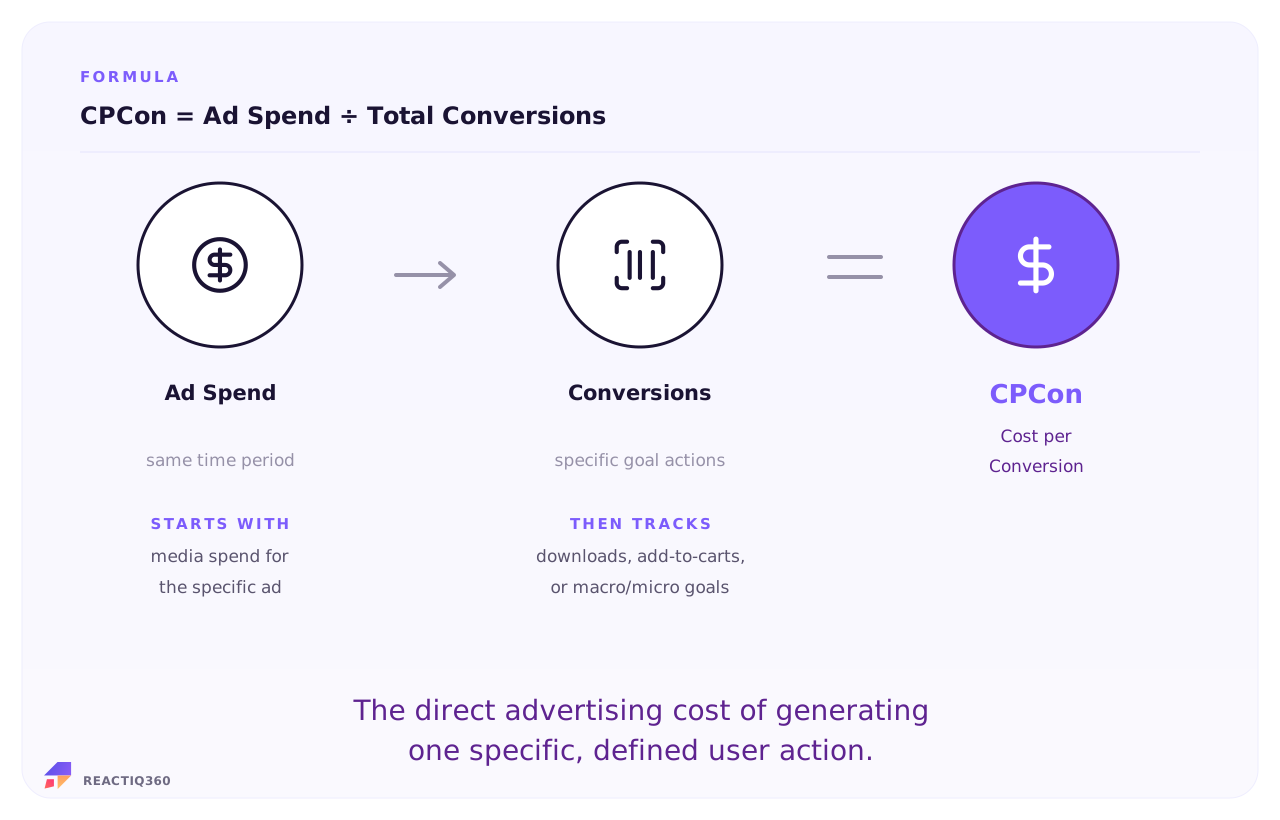
Divide ad spend by conversions. That is CPCon: the price of the outcome that moves revenue. Cost per Conversion (CPCon) is the ultimate reality check for performance marketing. It is easy to get distracted by top-of-funnel synergy, algorithmic volatility, or vanity metrics like impressions and clicks. CPCon strips away that noise by exposing the exact price tag on a real, bottom-line result like a sale or a qualified signup. By forcing a strict focus on the cost of the actual outcome rather than digital jargon, you instantly see which channels drive true growth and where to scale.
Signal Type
Metric Role
Metric Type
Last Updated
The Formula
Worked example

Isolate your spend to isolate the truth.

Here is a growth team reviewing a recent multi-channel acquisition campaign. They aggregate the exact ad spend dedicated to the push across platforms, tally the real conversions tracked in their billing system over the same date range, and calculate the true cost per outcome.

CPCon Calculator Section
Campaign Ad Spend
Google Search Ads $45,000
Meta Video Ads $32,000
Meta Retargeting $18,000
LinkedIn Sponsored Content $15,000

Total Ad Spend $110,000
Total Conversions (Signups) 2,500
$44
CPCon
$110,000 ÷ 2,500 conversions
Match your timelines perfectly. Running your total campaign spend against the exact conversions from that same window keeps your data clean and actionable.

Benchmarks and interpretation

Is your CPCon any good?

CPCon answers a simple question: what did it cost you to get one actual user action? But just looking at the raw dollar amount won't tell you if that number is healthy. A $100 CPCon is a massive win if you are selling a high-ticket software contract, but it is an absolute disaster if you are trying to push a $30 e-commerce product. CPCon only makes sense when you evaluate it directly against the immediate value of the conversion event and look at the realistic baselines for your specific industry.

Industry Vertical Typical CPCon Conversion Context
E-commerce / Retail $20–$60 Based on direct, first-time purchases. Highly sensitive to ad network seasonal spikes.
B2B Lead Generation $40–$150 Based on a qualified marketing lead or demo request, not a finalized deal.
Consumer Apps / Tech $5–$25 Based on low-friction actions like a verified free account setup or app download.
High-Ticket / Finance $150–$400+ Based on fully approved loan applications or high-intent wealth consultations.
The CPCon margin check
Evaluating your CPCon requires looking directly at your Average Order Value (AOV) or immediate contract value. While long-term metrics like lifetime value keep the finance team happy, your short-term conversion cost must stay below your upfront product margin to maintain healthy cash flow. If your CPCon creeps above the actual revenue generated by that specific conversion window, your campaigns are actively burning money regardless of what your click metrics claim.
Where the number actually comes from

You won’t find a clean, perfect CPCon number sitting neatly inside any single dashboard. True CPCon only happens when you grab your total marketing costs from one place, pull your actual, real-world conversion data from another, and stitch them together. If you just trust whatever number a single ad network spits out, you are looking at an incomplete and usually inflated picture of your performance.

CPCon Data Sources Table
Source What it provides Important nuance
Ad platforms Meta, Google, LinkedIn, TikTok Raw ad spend and what each platform claims it converted. Ad networks love to grade their own homework. Because windows overlap, multiple networks will take credit for the exact same customer action, artificially making your numbers look better than they are.
Analytics platforms GA4, Mixpanel, Attribution tools The overall user path and channel-by-channel breakdown. Flipping a setting from first-click to last-click instantly distorts your channel CPCon. Pick one attribution model, stick with it, and use it to map the real customer journey across platforms.
CRM & Billing systems Shopify, Stripe, HubSpot The final, undeniable count of real conversions. This is your source of truth. Make sure your conversion trigger matches a completed transaction or solid signup. Counting soft steps or pending actions will fake a lower CPCon.
Marketing tools & assets The cost of creative assets, landing pages, and tech tools. Decide early on if you want a clean view or a fully loaded view. For standard optimization, look strictly at your ad spend. For absolute business margin safety, add your creative and software bills.
When to use it

CPCon is the right metric in these decision contexts:

CPCon Bullet List
  • Assessing campaign efficiency. CPCon calculates the exact cost to generate a specific, revenue-driving outcome. Use it to protect immediate margins.
  • Optimizing budget across channels. Comparing channel-level CPCon reveals your most efficient platforms. Shift active budget to the lowest-cost outcomes.
  • Forecasting tactical ad spend. Multiplying target conversions by your average CPCon maps the budget required to hit short-term scaling goals.
  • Evaluating conversion funnels. Tracking CPCon across different user flows highlights the most cost-effective path. Use it to optimize your conversion pathways.
  • Benchmarking performance. Comparing your results to sector-specific conversion costs shows if your campaigns are competitive or need creative optimization.
Common Mistakes

CPCon is one of the most misreported metrics in marketing. The most common errors:

CPCon Mistakes List
  • Treating CPCon as a single-platform number. Spend, attribution, and conversions live in separate tools. You must consolidate these sources to get an accurate calculation.
  • Confusing CPCon with CPA or CAC. CPA tracks soft actions and CAC tracks paying customers. Mixing them up overstates your actual campaign efficiency.
  • Blending different conversion motions. Mixing low-friction micro-conversions with high-intent macro-conversions creates a meaningless average. Segment by action before reporting.
  • Reading CPCon in isolation. A dropping CPCon looks good, but means nothing if those conversions quickly churn. Always evaluate it against customer value.
  • Freezing on one time window. Single snapshots hide critical data trends. Use monthly views to catch immediate shifts and quarterly views to smooth out anomalies.
In the REACT framework

CPCon is the Convert phase cost metric and the fairest basis for channel comparison, because it prices results, not activity. Cheap clicks with costly conversions? The problem is upstream traffic, not your checkout.

Frequently Asked Questions
What is Cost per Conversion?
Cost per Conversion, or CPCon, measures how much spend it takes to produce one conversion. It prices the result, which makes it the fairest way to compare channels.
How do you calculate Cost per Conversion?
Use the formula: CPCon = Ad Spend ÷ Total Conversions. Keep both inputs in the same reporting period and avoid mixing users, sessions, events, or customers unless the formula calls for it.
What data do you need for CPCon?
You need ad spend and conversions, pulled from the relevant connected sources and computed for the same period.
What mistakes should you avoid with CPCon?
Keep the conversion definition identical everywhere, resist soft conversions creeping in, and when CPCon rises, look upstream at traffic quality before blaming the conversion step.
When should marketers use CPCon?
Use CPCon when allocating budget across channels. It prices the outcome rather than the activity, so it settles arguments that CPC and CPL only start.
What is a good CPCon?
The ceiling comes from your own economics: what a conversion is worth against margin. Below that ceiling, falling CPCon with stable conversion quality is the pattern you want.

Sources and methodology. CPCon formula and definition derive from standard marketing analytics practice and platform reporting conventions. REACTIQ360 harmonises source data from Ad platforms and marketing spend, CRM / ecommerce / billing, Harmonisation layer and applies a consistent same-period computation methodology.

One screen.
One story. One move.
REACTIQ360 harmonises CAC and 129 other digital marketing metrics into one decision-ready intelligence layer. Powered by proprietary metrics and agentic AI. Beta access is invite-only.
Join the beta waiting list