Awareness
Reach
Impressions Share
Impressions Share (IS)
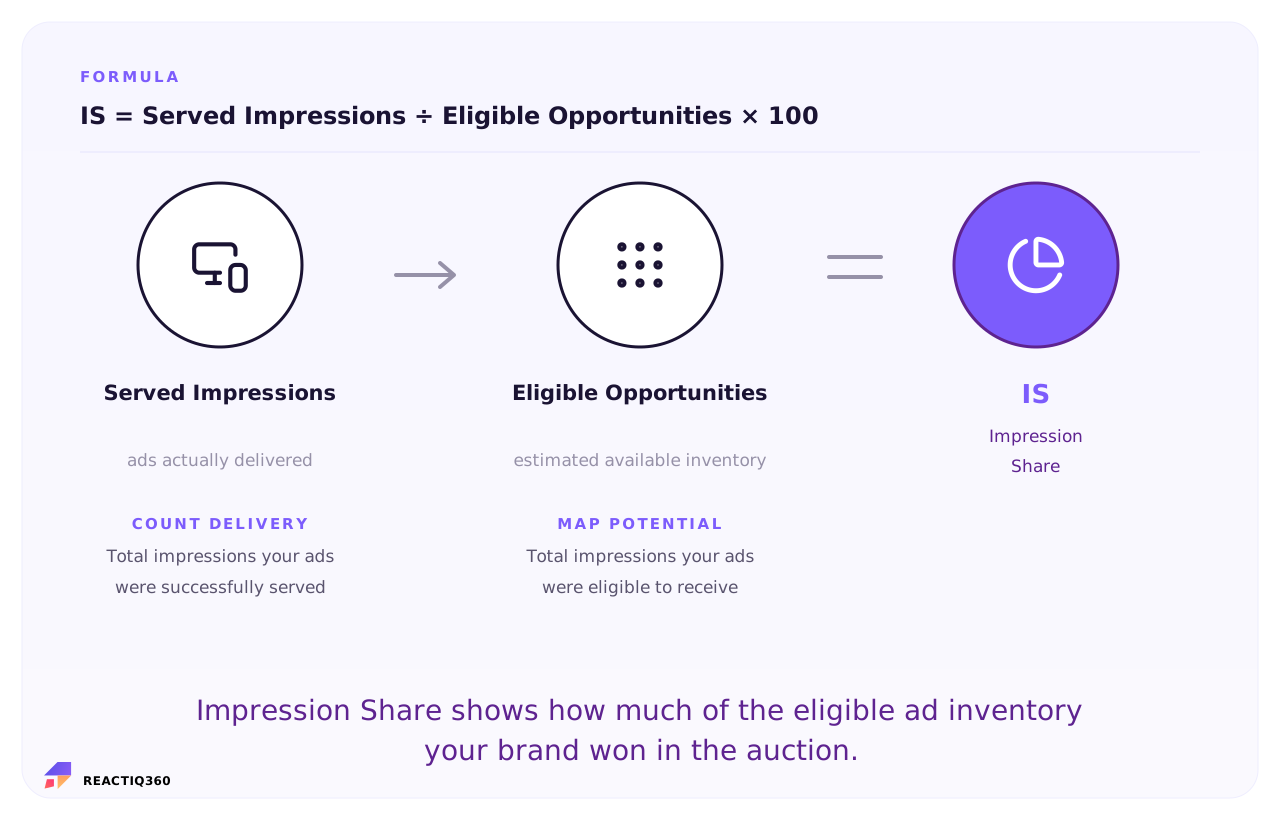
Impression Share tracks the exact percentage of eligible ad impressions your brand captured out of the total available inventory pool.
Divide impressions received by the total impressions you were eligible for, then multiply by 100. Impression Share shows how much of the available opportunity your ads captured and how much was lost to budget or ad rank.
Signal Type
Diagnostics
Metric Role
Metric Type
Last Updated
The Formula
Worked example

Compare your delivered impressions with eligible opportunities to find your true auction stock.

A team compares delivered impressions with the total impressions it was eligible to receive to see how much auction opportunity it captured and how much potential was lost.

IS Calculator Section
Auction Stock Opportunity Audit
Actual Delivered Impressions 75,000
Lost Volume Due to Budget Limits 15,000
Lost Volume Due to Low Bidding 10,000

Total Eligible Auction Impressions 100,000
75%
Impression Share
(75,000 served ÷ 100,000 eligible) × 100
Align your auction timeline. Running your actual served impressions directly against platform-modeled opportunities over that exact window keeps your available stock calculations realistic.
Benchmarks and interpretation

Impression Share targets depend on keyword intent. Aim high for brand terms, while broader competitive terms may justify a lower target. Where benchmarks are unavailable, use your lost share data to guide budget and Ad Rank improvements.

Auction Placement Pool Typical Target IS Auction Volume Presence Context
Branded Search Terms 85% – 95% Direct intent protection. Dominates available impression stock on your company name to keep competitors out.
High-Intent Commercial Terms 50% – 70% Active inventory scaling. Balance bidding configurations against budget limits to clear the most valuable ad placements.
Broad Conversational Terms 15% – 30% Exploratory stock logging. Deliberately restricted to protect total campaign spend from thinning out over cold placements.
The share-of-voice reality check
Impression share varies across platforms because each measures viewability and inventory differently. Use platform-reported viewable impressions or a trusted verification partner to compare costs and filter invalid traffic.
Where the number actually comes from

Impression Share varies by platform because eligibility is calculated differently. Use native auction insights to spot budget or Ad Rank limits.

IS Data Sources Table
Source What it provides Important nuance
Auction Dashboards Google Ads, Microsoft Advertising Direct platform-calculated share logs and lost impression breakdowns. Platforms model eligibility based on targeting parameters, bids, and budget choices. Narrowing your geo-filters instantly shrinks the eligibility pool, which can artificially inflate your calculated share.
Competitor Intelligence Auction Insights, search trackers Relative brand overlap details showing which rivals win your target spaces. These reports reveal exactly who is outbidding you on key search channels. A sudden drop in your share often means a well-funded competitor has entered the auction, not that your creative is broken.
When to use it

IS is the right metric in these decision contexts:

IS Bullet List
  • Defending branded keyword strings. Monitor your available inventory capture on your own company name to ensure competitors are not outbidding you on your own terms.
  • Scaling profitable display setups. Check your lost auction share to see if a high-performing placement has enough un-tapped inventory volume to handle a budget injection.
  • Diagnosing competitive auction shifts. Evaluate your inventory share trends when clicks suddenly drop to check if aggressive rivals are outbidding your placements.
  • Mapping inventory saturation parameters. Review your maximum impression limits to identify exactly when an ad group has tapped out its available stock.
  • Auditing seasonal budget limitations. Track your share metrics during peak traffic weeks to ensure daily budget caps are not shutting your ads off before the inventory clears.
Common Mistakes

Ad platforms hide lost potential behind confusing auction settings. When analyzing your Impression Share data, watch out for these frequent blind spots:

IS Mistakes List
  • Confusing your raw auction impression stock with unique human reach. High inventory share only proves you won the digital placements, not that you reached new individual buyers.
  • Chasing maximum inventory share on low-converting target pools. Maxing out visibility on broad, untargeted placements burns your budget without driving pipeline metrics.
  • Assuming a drop in stock share means your creative ad copy is broken. Lowering daily budget limits or getting hit with aggressive competitor bids will drop your score regardless of your layouts.
  • Failing to isolate target matches from broad network groupings. Blending high-intent search terms with loose contextual programmatic placements yields an arbitrary average that hides true inventory demand.
  • Pumping money into uncompetitive bids without fixing landing page friction. Trying to buy inventory dominance fails if low quality metrics keep penalizing your placement costs.
In the REACT framework
Frequently Asked Questions
What is Total Served?
Total Served, or Imp, counts how many times your ad or content was served, not how many people saw it. It sets the volume baseline that every efficiency metric divides by.
How do you calculate Total Served?
Use the formula: Impressions = Total Screen Loads Counted. Keep both inputs in the same reporting period and avoid mixing users, sessions, events, or customers unless the formula calls for it.
What data do you need for Imp?
You need content served and times counted, pulled from the relevant connected sources and computed for the same period.
What mistakes should you avoid with Imp?
The mistakes are old but alive: reporting served counts as people reached, ignoring viewability, and letting one person seen ten times masquerade as ten people seen once.
When should marketers use Imp?
Use impressions as a denominator and a delivery check, not as a result. The decisions they support are about volume: is enough being served, and is the arithmetic underneath CTR and CPM sound?
What is a good Imp?
There is no good number of impressions, only enough to feed the metrics built on them. Judge delivery against plan, and judge meaning through viewability, reach, and qualification.

Sources and methodology. Imp formula and definition derive from standard marketing analytics practice and platform reporting conventions. REACTIQ360 harmonises source data from Ad and platform APIs, Campaign taxonomy, Harmonisation layer and applies a consistent same-period computation methodology.

One screen.
One story. One move.
REACTIQ360 harmonises CAC and 129 other digital marketing metrics into one decision-ready intelligence layer. Powered by proprietary metrics and agentic AI. Beta access is invite-only.
Join the beta waiting list