Viewability Rate
Viewability Rate (VR)
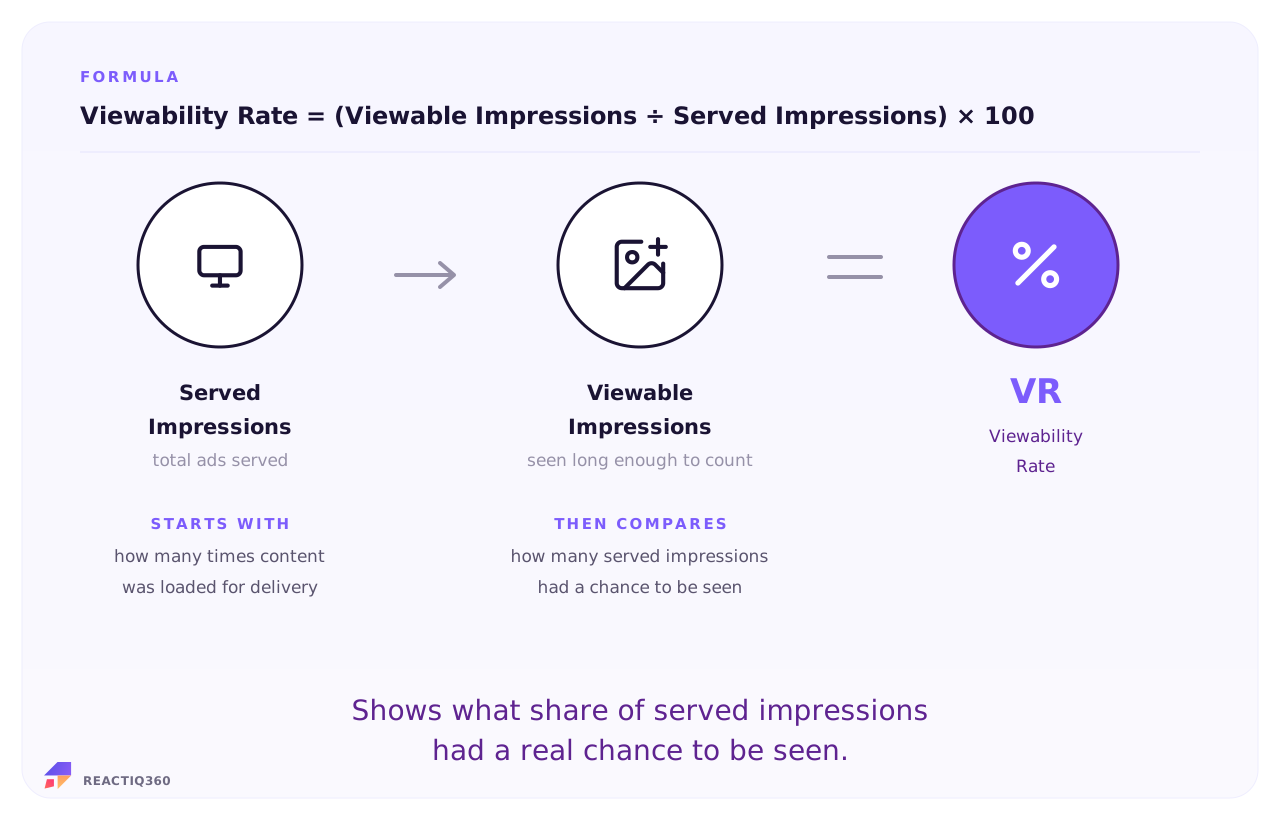
Viewability Rate measures what share of your served impressions actually had a chance to be seen.
Divide viewable impressions by total impressions. That is Viewability Rate: how much of your delivery could a human actually have seen? Care, because invisible inventory eats budget before any other metric gets a chance. A floor to clear, not a goal to chase.
Signal Type
Metric Role
Metric Type
Last Updated
The Formula
Worked example

Here is a team auditing their ad channels. They check their direct social ads which report viewability natively, and apply an industry benchmark proxy to their programmatic exchange network to filter out unseen placements.

Viewability Rate Calculator Section
Campaign Media Log Audit
Social Impressions (Natively Tracked Viewability) 1,200,000
Programmatic Network Impressions (Applied Benchmark Proxy) 800,000

Total Delivered Impressions 2,000,000
Assessed Viewable Impressions 1,360,000
68%
Viewability Rate
(1,360,000 viewable ÷ 2,000,000 total) × 100
Align your parameters. Combining native dashboards with independent industry proxies over the exact same window keeps your visibility data realistic.
Benchmarks and interpretation

Since many ads load completely out of sight, pairing your raw volume with native viewability rates or industry benchmarks is a smart strategic move. Applying those visibility baselines helps you filter out unseen placements and gauge the true on-screen impact of your media budget.

Distribution Channel Typical Viewability Rate Placement Context
Direct Publisher Premium 75% – 90% Direct deals build placement certainty. Assets sit cleanly above the fold within primary content areas.
Native Placements / Social Feeds 60% – 75% In-feed configurations align with natural reader flows. Natively reported or verified easily via custom dashboards.
GDN & Programmatic Exchanges 40% – 60% Standard banner networks look cheap but carry higher risks of below the fold placements and fast user scrolling.
The visibility audit check
Tracking your viewability rate serves as an excellent inventory filtration roadmap. A channel that boasts massive numbers of super cheap impressions might look great on general spreadsheets, but it actively harms your campaign efficiency if half of those pixels are rendering off screen. Organizing your rates by placement stream provides a clear strategic edge, letting you optimize distribution networks to ensure your budget goes strictly toward visible, human media opportunities.
Where the number actually comes from

You will not find Viewability Rate in every platform dashboard. Some platforms report it directly, while others do not. Where it is unavailable, marketers can use reliable industry benchmarks to assess performance.

Viewability Rate Data Sources Table
Source What it provides Important nuance
Native ad platforms Google Ads, Meta Business Suite Direct, native viewability rate percentages inside your standard reporting tables. These platforms report your visibility metrics natively because they have direct script access to screen coordinates. Always check if you need to manually add the viewability column to your custom dashboard view.
Content discovery & web banner networks Taboola, Outbrain, Programmatic open exchanges Variable or hidden visibility metrics depending on the vendor or direct contract setup. Many cheaper programmatic networks do not display viewability data upfront to hide low-quality placements. If a platform hides this column, you are flying blind unless you plug in independent third-party verification tools.
Industry baselines IAB viewability standards, agency benchmark reports A reliable proxy metric to assess and score your current media execution. When a dashboard leaves you with unmeasurable data slots, apply reliable sector baselines to spot poor inventory channels. If your platform CTR is trailing well below industry norms, assume your ads are loading unseen.
When to use it

Viewability Rate is the right metric in these decision contexts:

Viewability Rate Bullet List
  • Vetting ad exchange inventory quality. Use it to instantly rank programmatic vendors and blacklist domains that consistently load banners in hidden or un-viewable page zones.
  • Enforcing premium publisher agreements. Protect direct media contracts by holding publishers accountable to specific screen view thresholds before closing out billing periods.
  • Fixing misleading click-through data. Evaluate your viewability rates first when analyzing flat click performance to see if the creative was weak or just completely invisible.
  • Optimizing ad device layouts. Compare mobile and desktop visibility ratios to spot responsive design glitches that throw your banners off screen on specific hardware types.
  • Sanity-checking awareness reach. Ensure your top of funnel brand budgets are funding visible impressions rather than ghost code executions that never cross human view.
Common Mistakes

Proving your ads were actually seen takes some technical know-how. When analyzing your viewability rates, look out for these common traps:

Viewability Rate Mistakes List
  • Equating a viewable screen state with actual customer attention. Meeting the technical benchmark of fifty percent pixels on screen for one second does not prove a human noticed your text.
  • Ignoring unmeasurable inventory chunks in the calculation. Heavy cross-domain frame restrictions can block your tracker from reading coordinates, which artificially deflates your true performance rates.
  • Blending display banner math with strict video timelines. Merging static graphics and video streams hide the fact that users skip video spots way before the two second rule kicks in.
  • Relying on a single global score across all content networks. A blended seventy percent rate can conceal the reality that your native feeds are winning while programmatic boxes are completely hidden.
  • Allowing bot emulation patterns to fake viewability status. Advanced traffic farms script bots to linger over hidden page coordinates, satisfying geometric rules while yielding zero business value.
In the REACT framework

Viewability Rate is Reach phase quality control: the step between served and seen. Low viewability means budget buying invisible inventory, and nothing downstream can rescue an ad nobody could see. Audit this first.

Frequently Asked Questions
What is Viewability Rate?
Viewability Rate measures what share of your served impressions actually had a chance to be seen. It checks how much of your delivery could physically be seen.
How do you calculate Viewability Rate?
Use the formula: Viewability Rate = Viewable Impressions ÷ Impressions. Keep both inputs in the same reporting period and avoid mixing users, sessions, events, or customers unless the formula calls for it.
What data do you need for VR?
You need served impressions and viewable impressions, pulled from the relevant connected sources and computed for the same period.
What mistakes should you avoid with VR?
Avoid celebrating the campaign average while individual placements run near-invisible, and avoid confusing viewable with viewed. The standard proves opportunity, never attention.
When should marketers use VR?
Use Viewability Rate before touching anything else in paid media. Low viewability means budget is buying invisible inventory, and no creative or targeting decision can fix what nobody could see.
What is a good VR?
Industry norms sit well below 100 percent, and the standard itself is modest. Treat strong viewability as the floor that lets other metrics mean something, not as an achievement.

Sources and methodology. VR formula and definition derive from standard marketing analytics practice and platform reporting conventions. REACTIQ360 harmonises source data from Ad and platform APIs, Campaign taxonomy, Harmonisation layer and applies a consistent same-period computation methodology.

One screen.
One story. One move.
REACTIQ360 harmonises CAC and 129 other digital marketing metrics into one decision-ready intelligence layer. Powered by proprietary metrics and agentic AI. Beta access is invite-only.
Join the beta waiting list